US Freight Rates for May 2024 Trends and Statistics
In May 2024, the US freight industry experienced notable changes in van, reefer, and flatbed freight rates. Understanding the latest data is crucial for making informed decisions as businesses navigate these shifts. This article delves into the current statistics, regional variances, and load-to-truck ratios to provide a comprehensive overview of the freight landscape.
National Van Rate Averages
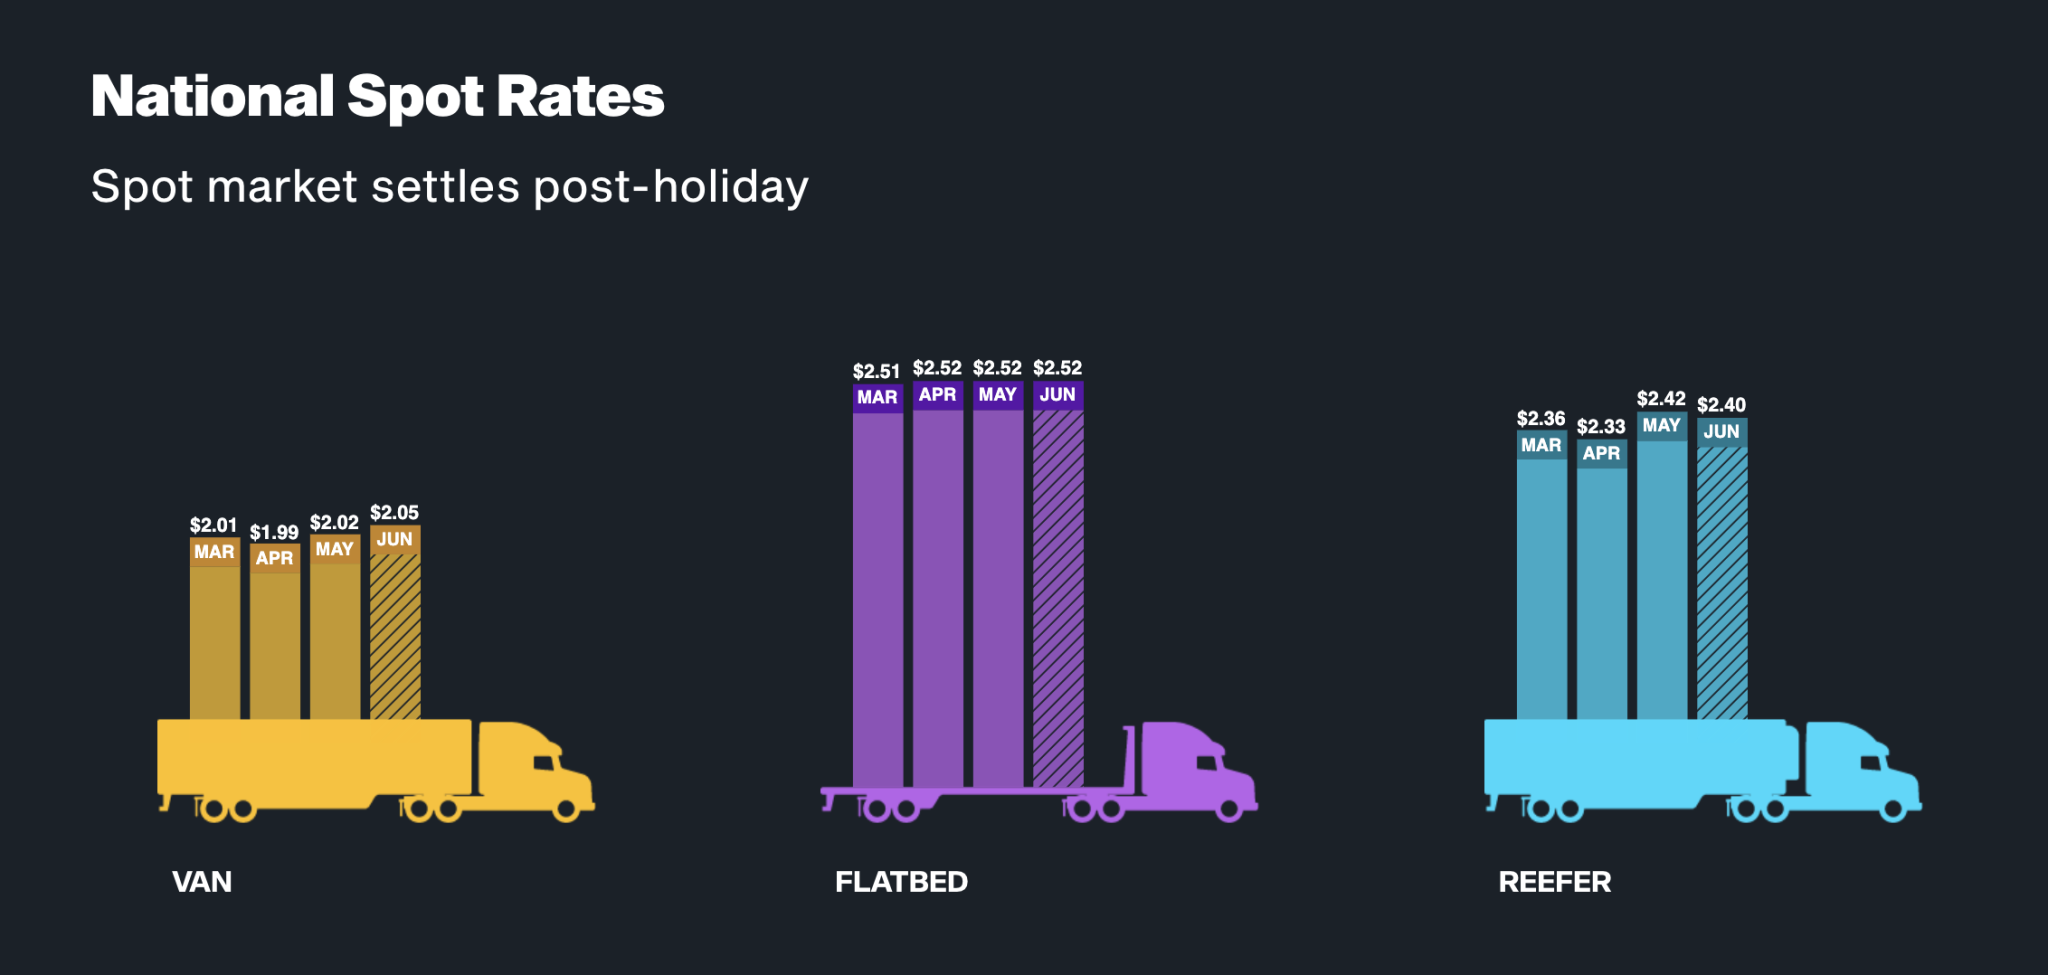
The DAT Trendlines Report from May 19th, 2024, highlights a slight increase in national van rate averages, now at $2.01 per mile, up by $0.02 from April. This increment, though modest, signals an ongoing adjustment in the freight market.
Regional Breakdown of Van Freight Rates
Midwest: The Midwest boasts the highest average van rates at $2.10 per mile, reflecting robust demand and possibly tighter capacity in this region.
East Coast: Conversely, the East Coast sees the lowest van rates, averaging $1.74 per mile, indicating either less demand or more abundant capacity.
Load-to-Truck Ratios for Van Freight
The national load-to-truck ratio has surged to 4.93, a significant jump from April’s 3.54. This ratio is a critical indicator of market balance, suggesting a heightened demand for van freight services relative to available trucks.
Southern States: The South leads with the highest load-to-truck ratios, indicating strong demand and possibly tight capacity.
Northern States: The North has the lowest ratios, suggesting more truck availability or less freight demand.
Reefer Freight Rates and Trends
Reefer freight rates have seen a downturn, averaging $2.40 per mile in May 2024, down by $0.07 from April. This decline might reflect seasonal shifts or changes in supply chain dynamics.
Regional Reefer Rate Analysis
West: The highest reefer rates are in the West, averaging $2.47 per mile, underscoring strong demand for refrigerated transport.
Northeast: The lowest rates are at $1.90 per mile, indicating potentially lower demand or higher availability of reefer trucks.
Load-to-Truck Ratios for Reefer Freight
Reefer capacity has increased significantly, with a national load-to-truck ratio of 7.91, compared to April’s 4.78. This rise suggests a considerable increase in reefer freight demand.
Southern States: Demand is exceptionally high in the Southern states, reflected in elevated load-to-truck ratios.
Midwest and Northeast: These regions show the lowest ratios, possibly due to lower demand or higher truck availability.
Flatbed Freight Rates and Regional Variations
Flatbed freight rates have marginally increased to an average of $2.53 per mile in May, up by $0.01 from April. This stability indicates a balanced supply-demand dynamic in the flatbed segment.
Regional Flatbed Rate Insights
Southeast: The Southeast exhibits the highest flatbed rates at $2.67 per mile, highlighting strong demand for flatbed services.
West: The West has the lowest rates at $2.27 per mile, possibly due to lower demand or more available flatbed trucks.
Impact of Freight Rate Trends on the Industry Understanding these freight rate trends is essential for stakeholders in the logistics and transportation sectors. The variations in rates and load-to-truck ratios across different regions indicate shifting demands and capacities that can influence pricing, service availability, and strategic planning.
Navigating the Current Freight Market These statistics provide critical insights for optimizing logistics strategies for businesses relying on freight services. Adjusting to regional rate variances and understanding load-to-truck dynamics can lead to more efficient and cost-effective operations.